Two examples, not a complete cash-flow map.
Context and limits
Follow one documented relationship at a time. These examples use different accounting measures and must not be added together.
These examples stay on the districts named below when you choose another district.
Read this as an accounting relationship. The same interdistrict amount appears in the two records. Adding district totals retains these internal entries; it does not show only money entering or leaving the seven districts.
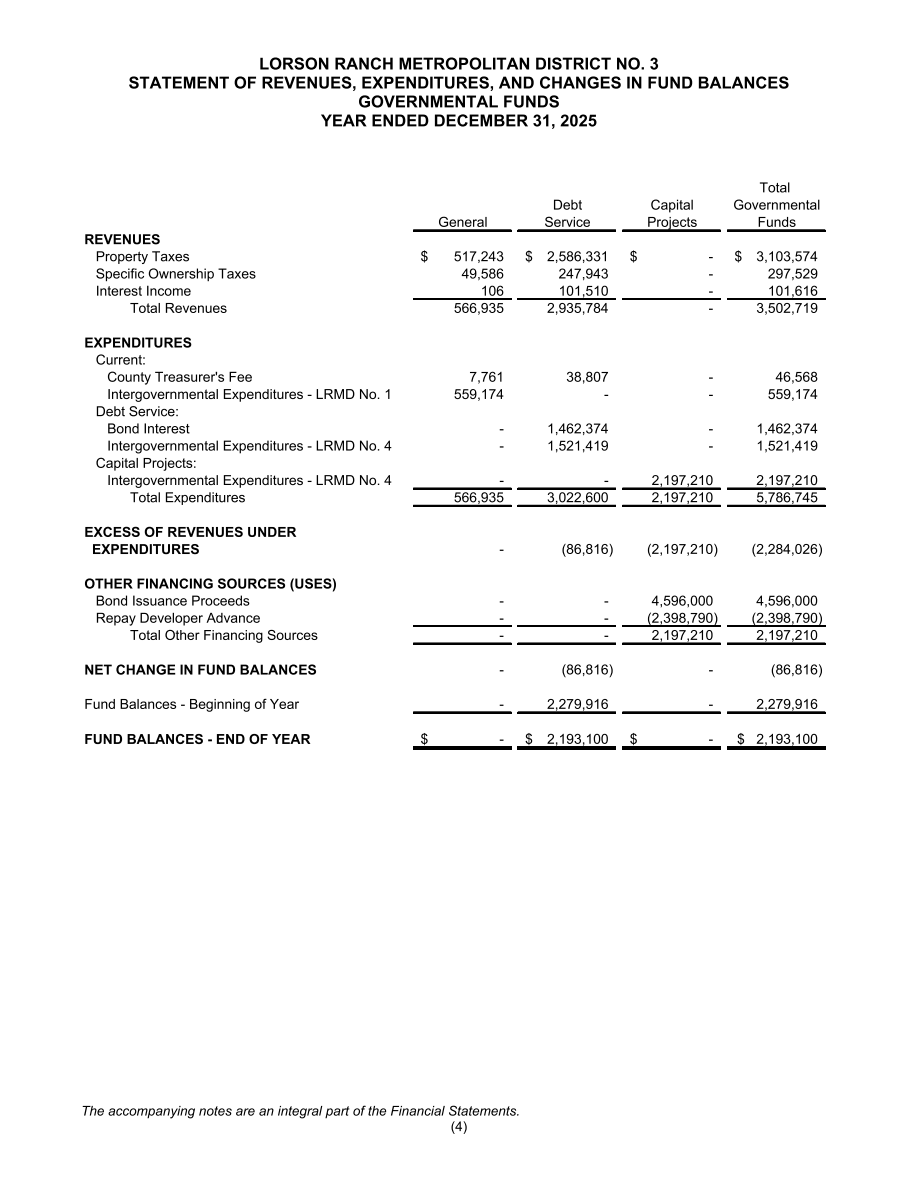
MD 3 reports $1,521,419 plus $2,197,210 in expenditures to MD 4. MD 4 reports matching revenue of $3,718,629. Period: year ended December 31, 2025.
The diagram does not establish the dates of individual cash movements.
Not ordinary cash operating spending. MD 1 reports the amount as capital outlay and the same amount as capital dedication under other financing sources. Its notes identify infrastructure assets received.
MD 1’s 2025 record describes $47,210,168 of infrastructure dedication from MD 6. Period: year ended December 31, 2025. This is a separate accounting category from the reported interdistrict expenditure example.
Selected relationships only, not a complete map of all seven districts. Arrow widths do not represent dollar amounts. Budget plans and debt events are separate from these examples.